PROJECT CONTEXT
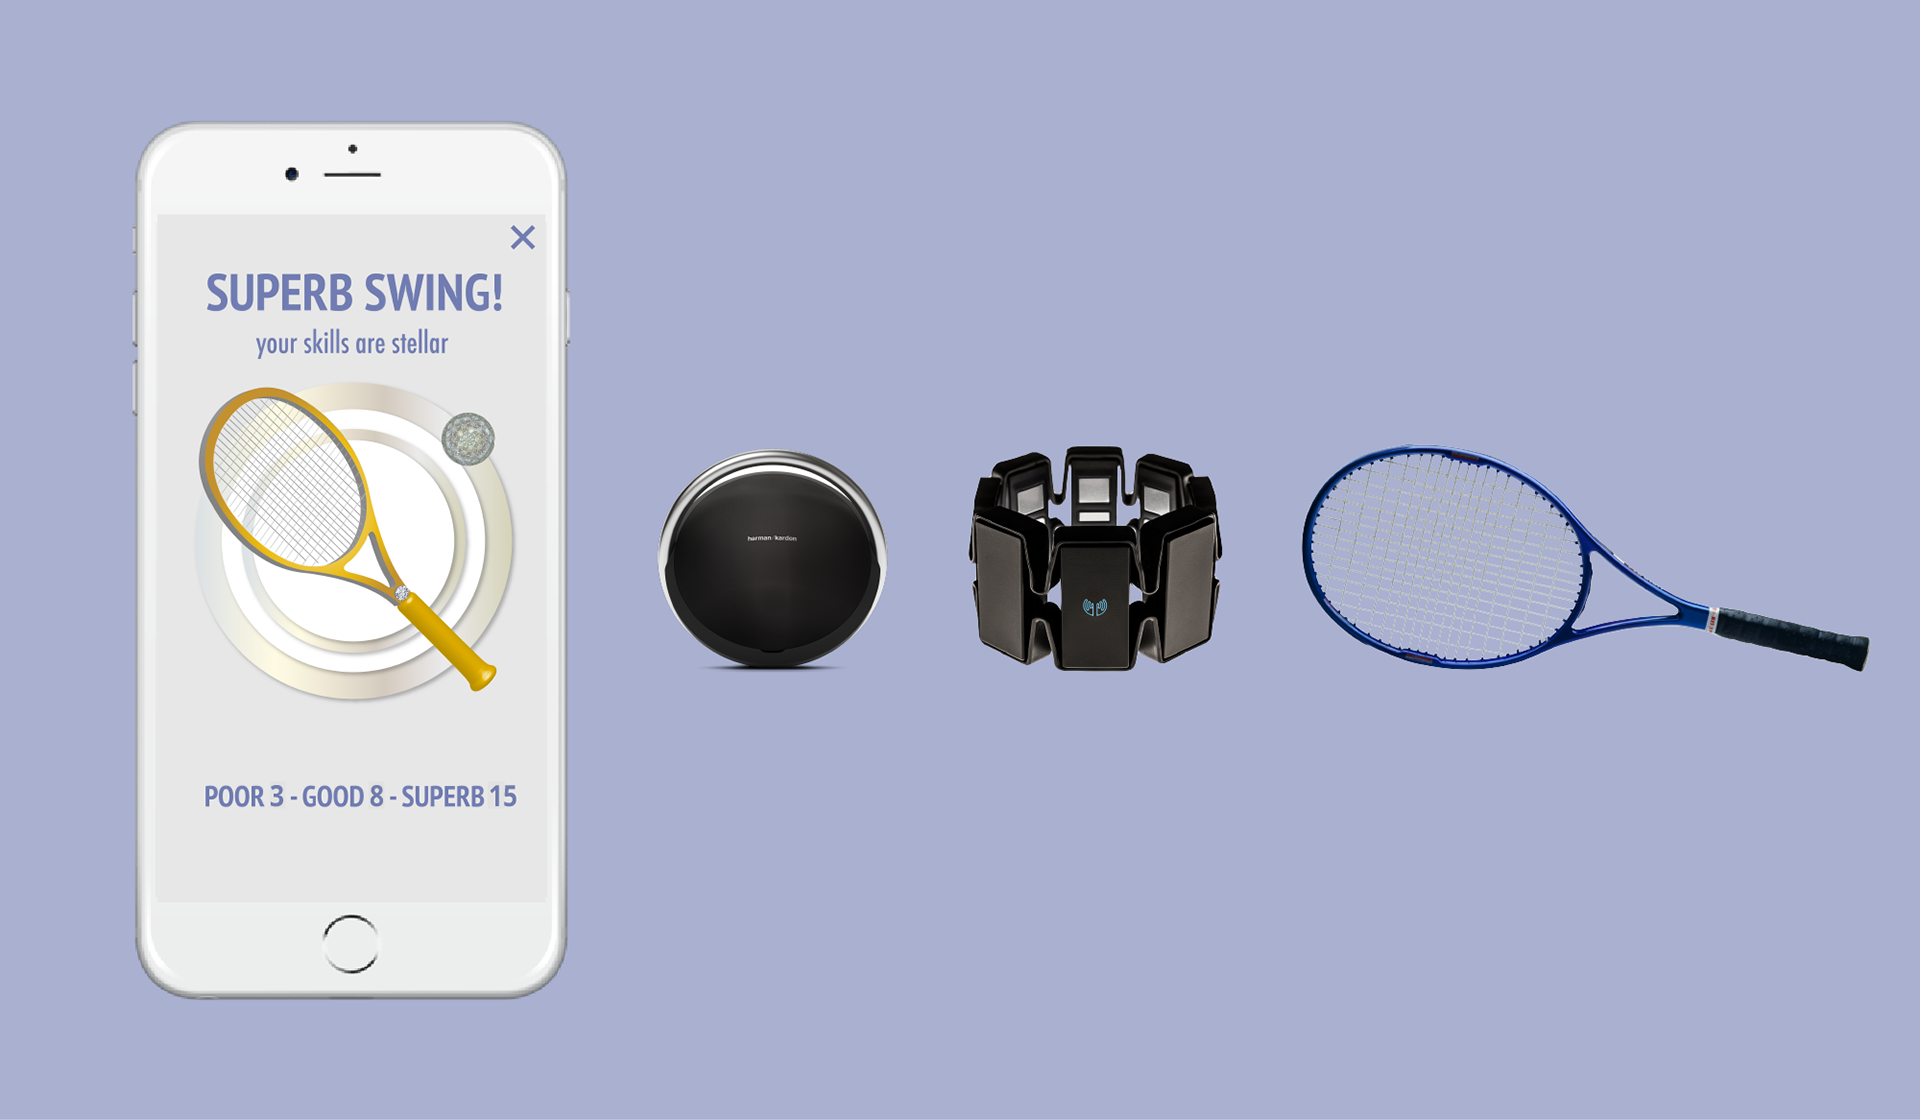
PracTest was created at the AT&T Hackathon in Santa Monica. This special IoT focused Mobile App Hackathon focused on hacking production or prototyping hardware.
PracTest was created at the AT&T Hackathon in Santa Monica. This special IoT focused Mobile App Hackathon focused on hacking production or prototyping hardware.
DESIGN PROCESS
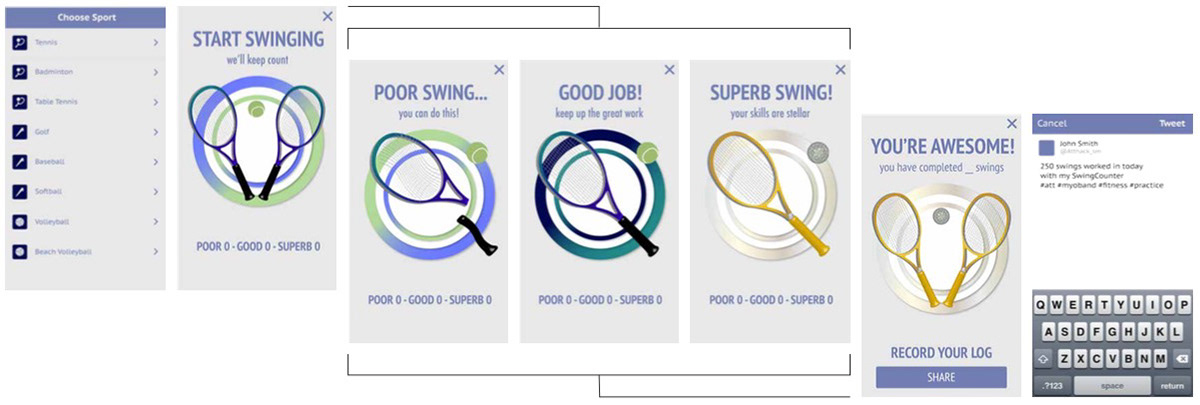
A unique integrative idea was quickly formed on-site from the available hardware that was provided. Provided hardware at the hackathon and their API documentation was researched to gain better understanding of the technologies being integrated. A solid product design was formed, and features were laid out as a foundation which roughly helped shape user experience and interaction flows. After sketches loosely formed the user interfaces and user journey, wireframes were made to further define the user interface design. Throughout the design and development process, I checked in my ideas and designs with the developers to make sure that every part was understood and agreed upon. Completed final versions of the user interface screens were made, an extra set of designs were labeled for easy translation and assets were sent to the front-end developer.
A unique integrative idea was quickly formed on-site from the available hardware that was provided. Provided hardware at the hackathon and their API documentation was researched to gain better understanding of the technologies being integrated. A solid product design was formed, and features were laid out as a foundation which roughly helped shape user experience and interaction flows. After sketches loosely formed the user interfaces and user journey, wireframes were made to further define the user interface design. Throughout the design and development process, I checked in my ideas and designs with the developers to make sure that every part was understood and agreed upon. Completed final versions of the user interface screens were made, an extra set of designs were labeled for easy translation and assets were sent to the front-end developer.
MY ROLE
I worked with two JavaScript developers through the creation of this mobile app. I was the UX/UI Designer and Graphic Designer of the group of three. I communicated with the two developers to define the set of product functionalities, confirm the user journey, and determine the information given in the user interface screens. I checked in with the progress throughout the creation, and made any adjustments that needed to be made in the design in order for smooth integration into the mobile app. I provided labeled screens (hex color codes, font size, font name) and digital assets (png images and icons in correct sizes) to the developer in charge of the front-end implementation.
I worked with two JavaScript developers through the creation of this mobile app. I was the UX/UI Designer and Graphic Designer of the group of three. I communicated with the two developers to define the set of product functionalities, confirm the user journey, and determine the information given in the user interface screens. I checked in with the progress throughout the creation, and made any adjustments that needed to be made in the design in order for smooth integration into the mobile app. I provided labeled screens (hex color codes, font size, font name) and digital assets (png images and icons in correct sizes) to the developer in charge of the front-end implementation.
USER EXPERIENCE
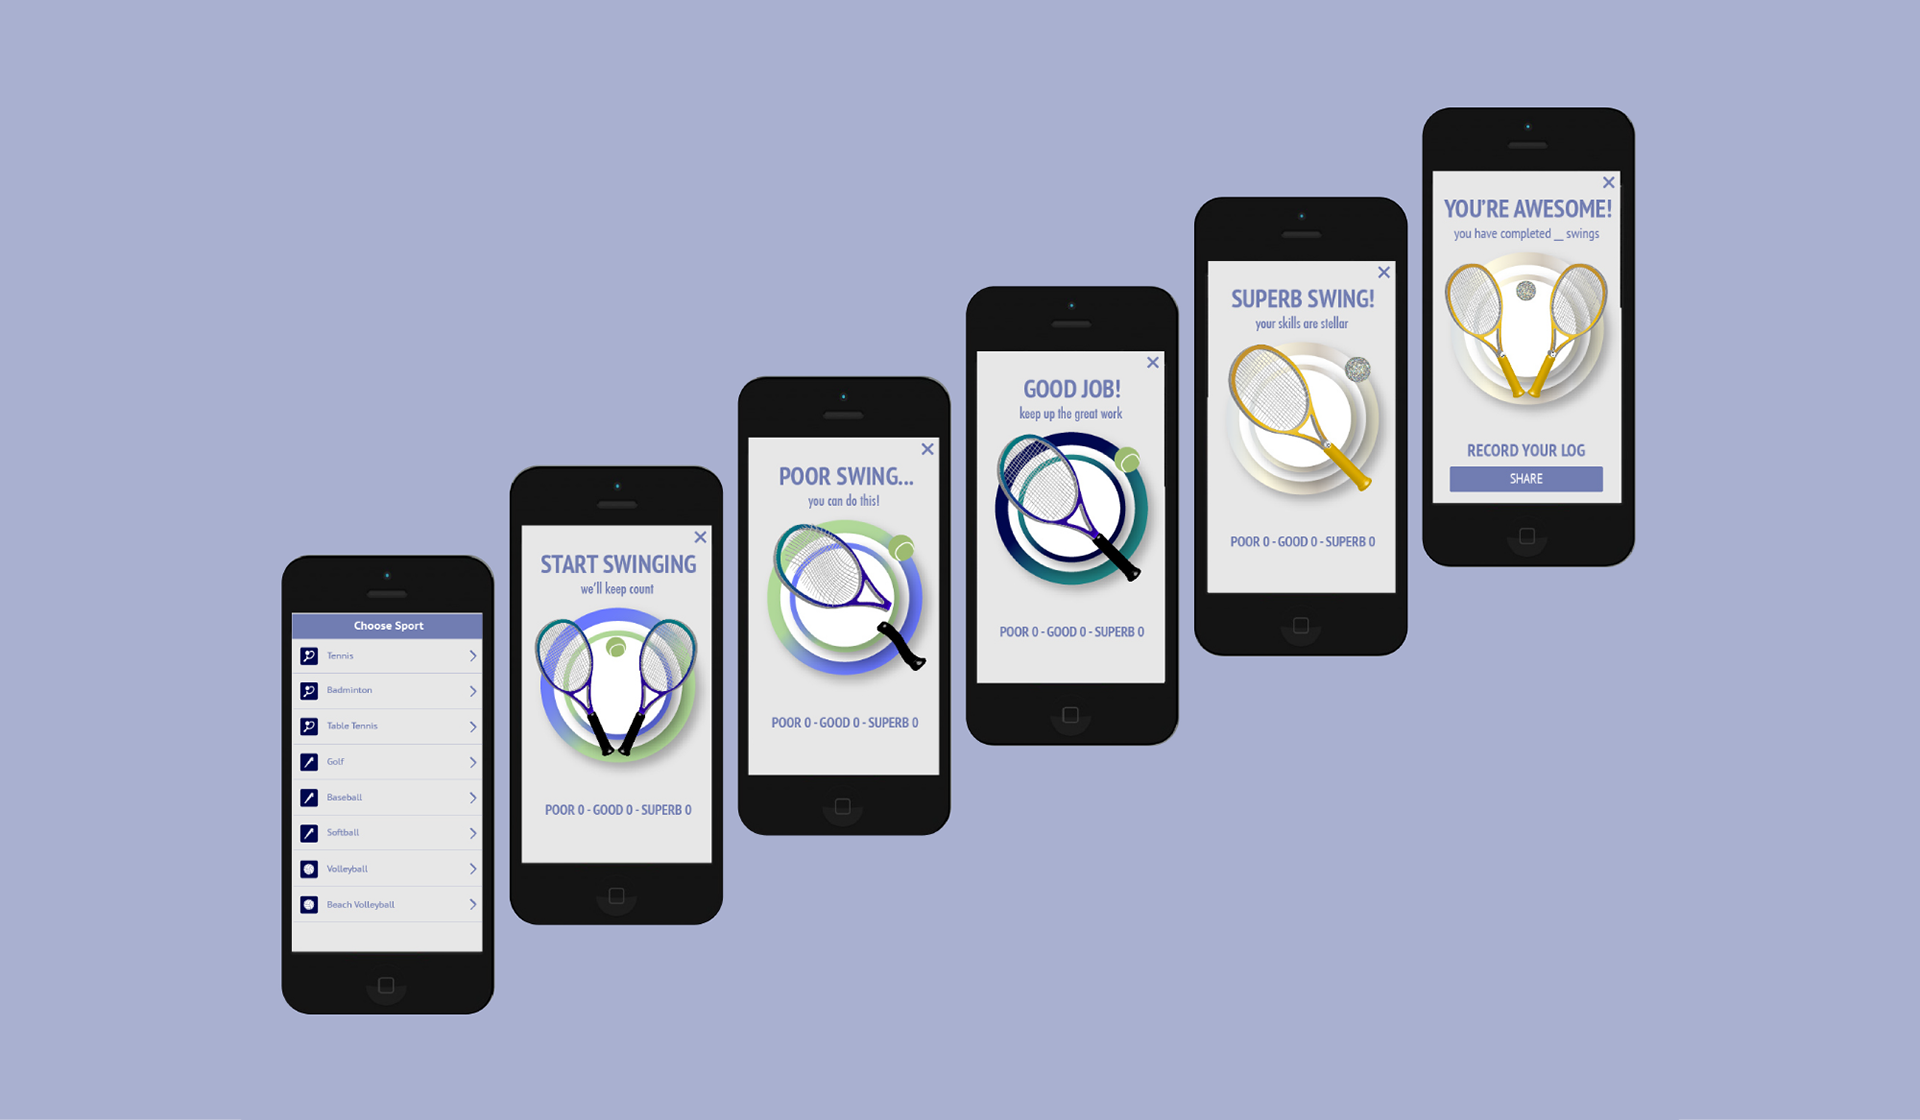
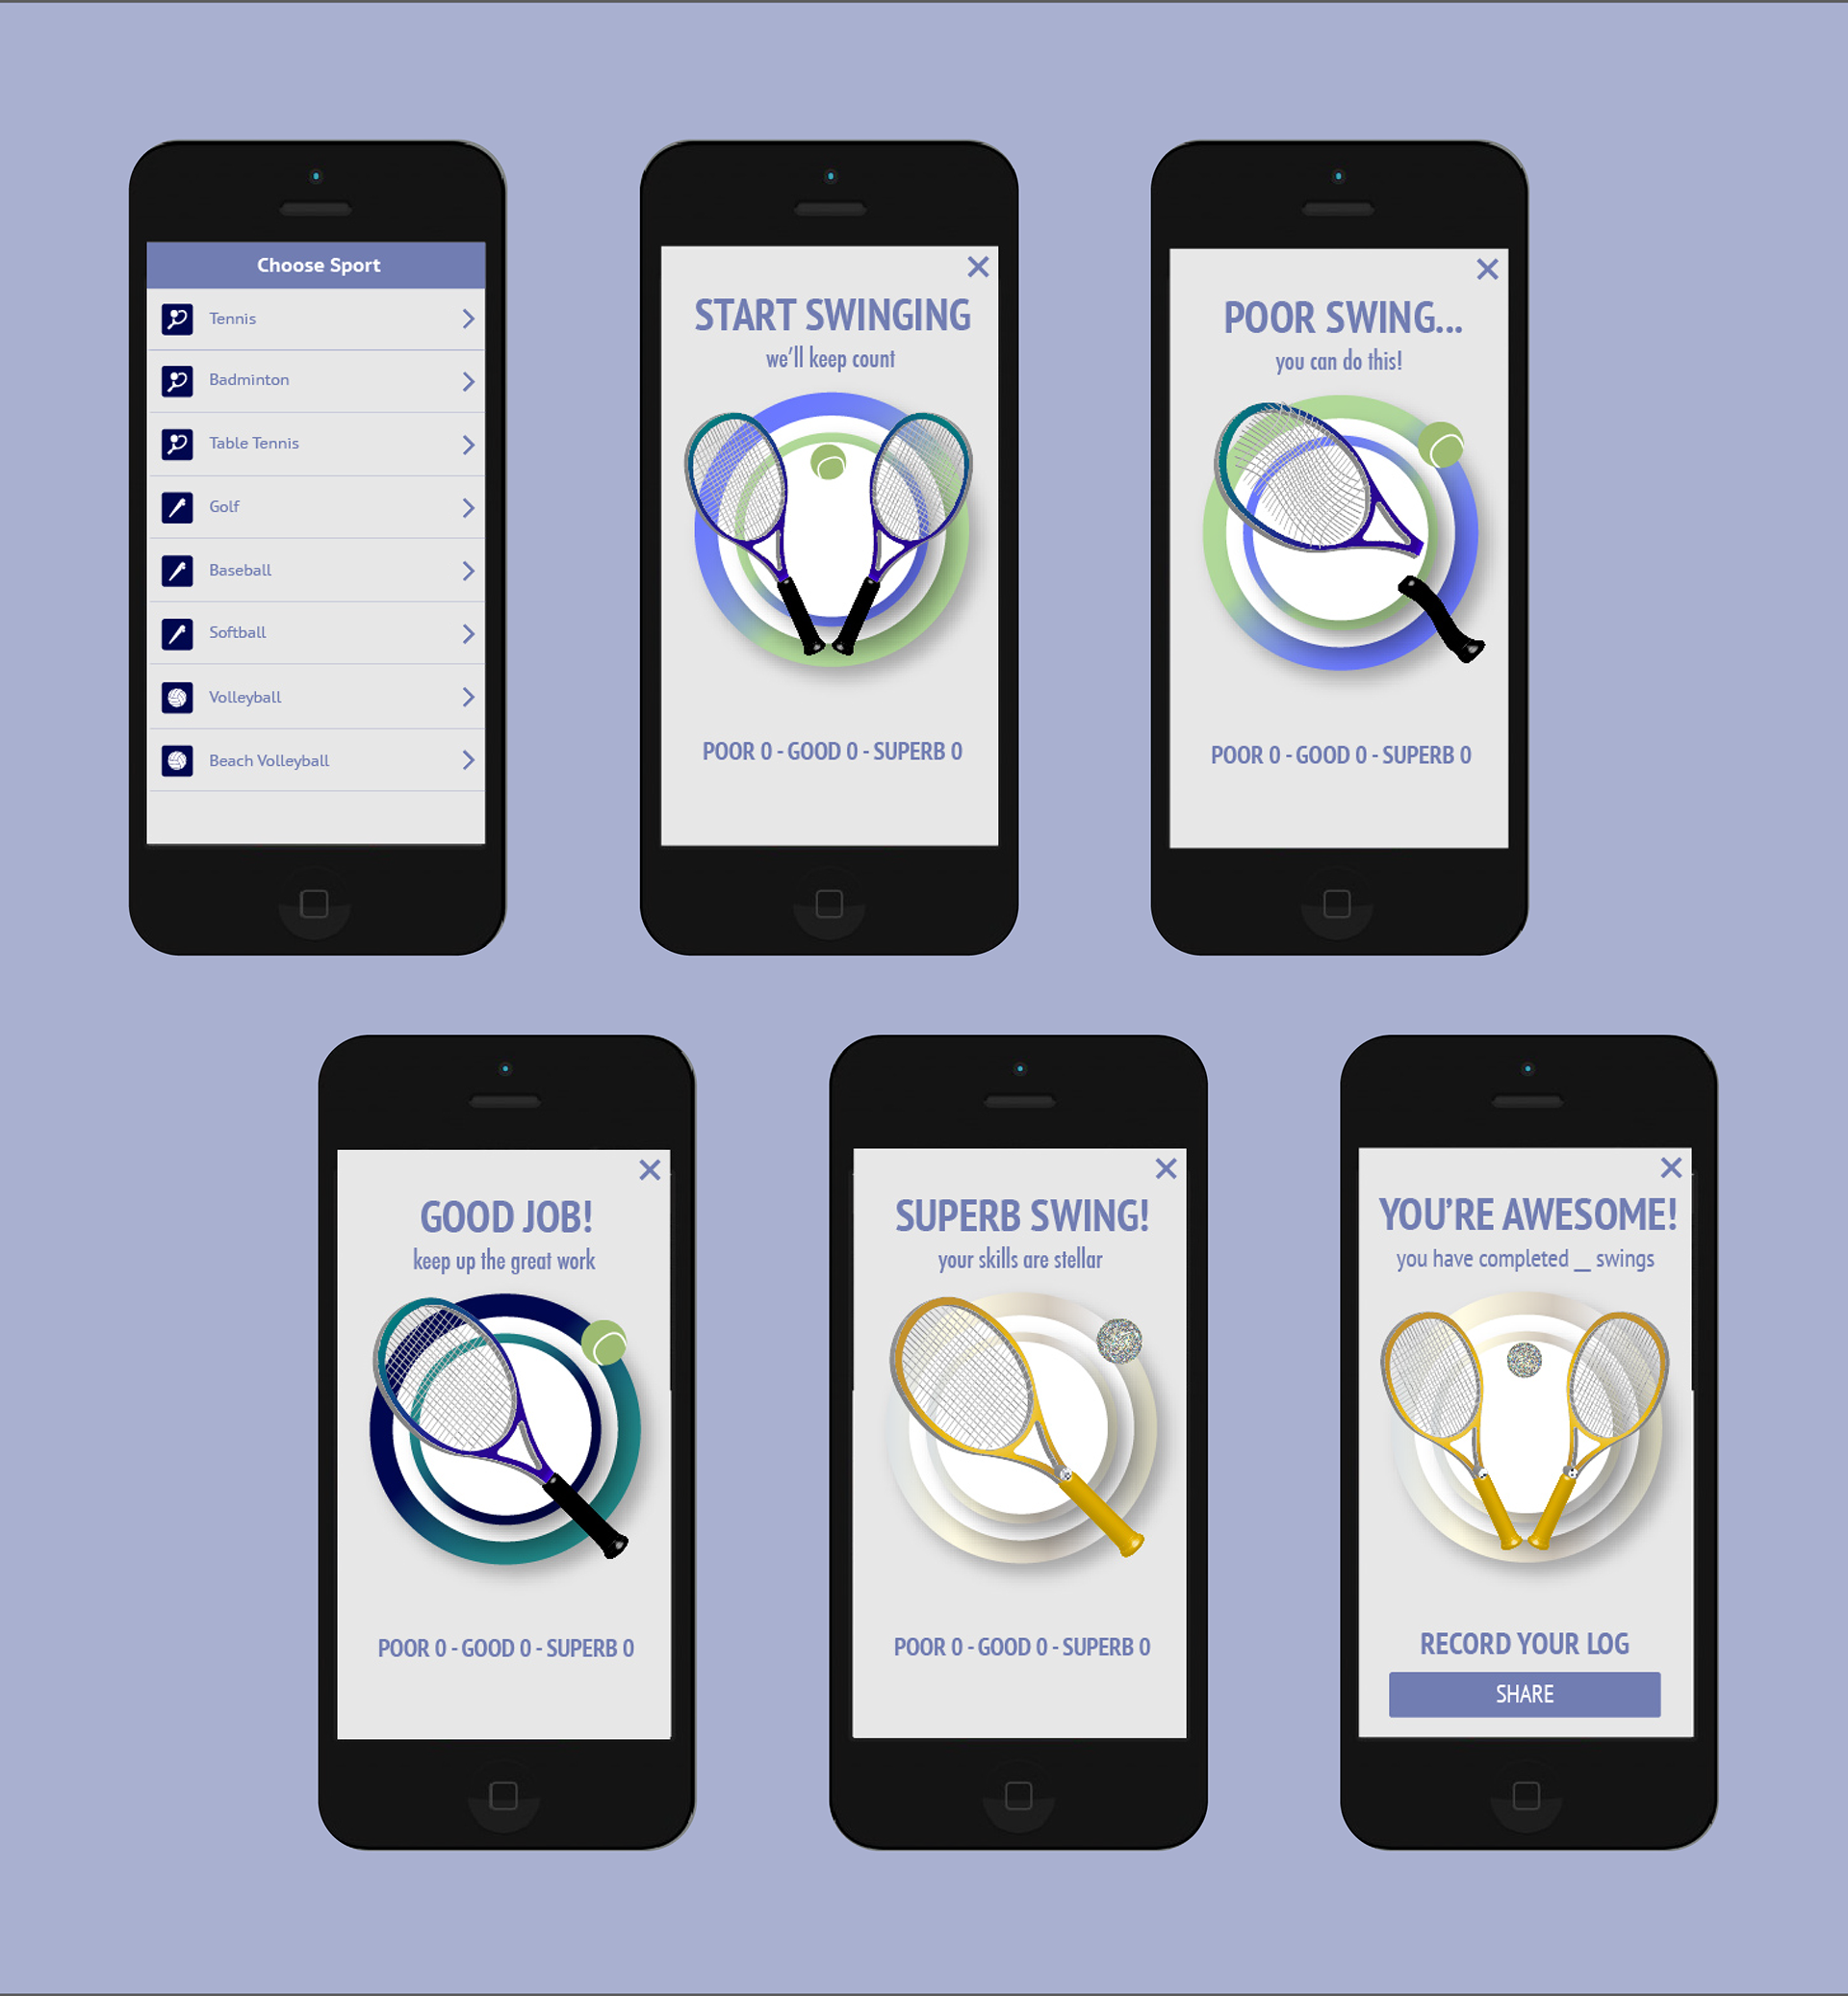
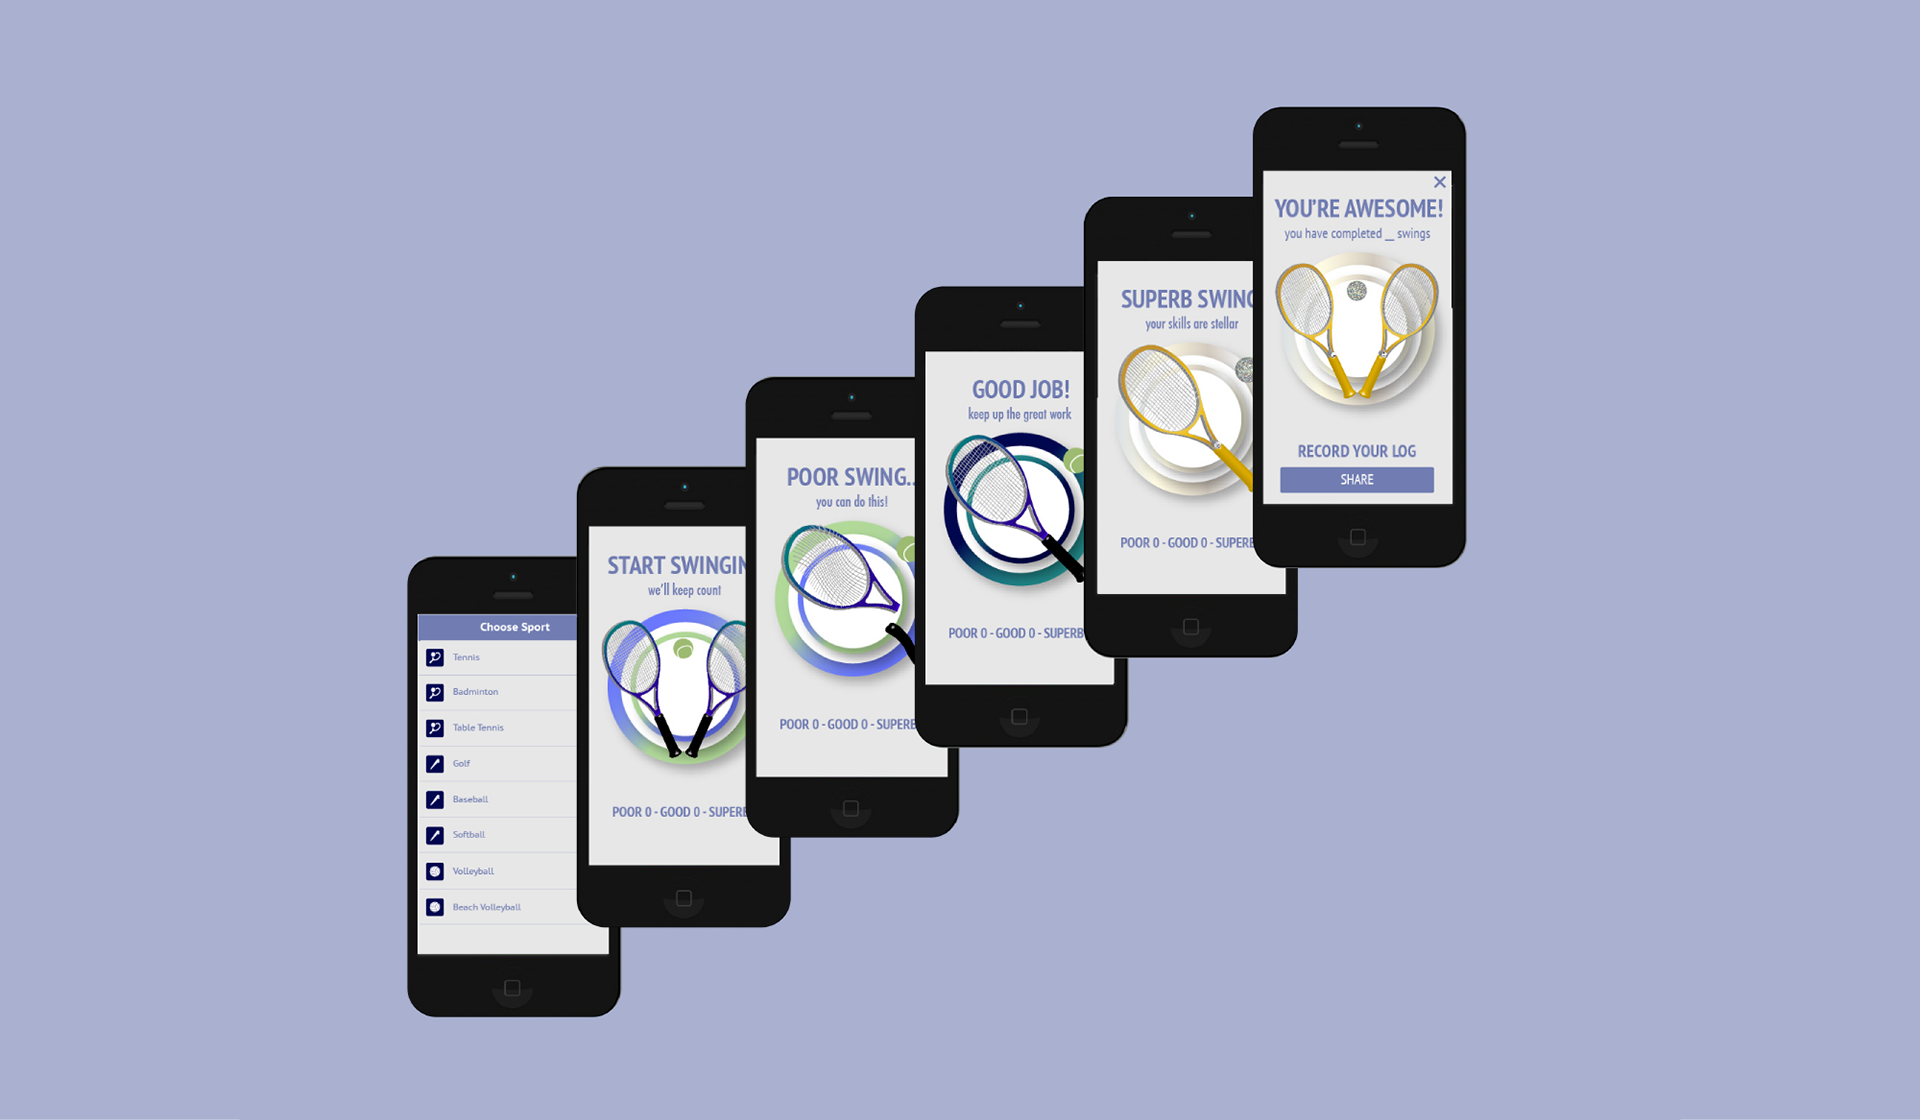
The user would first choose from a list of sports to practice with the Myo armband on. The user can exit or start swinging as PracTest keeps count according to arm movements.
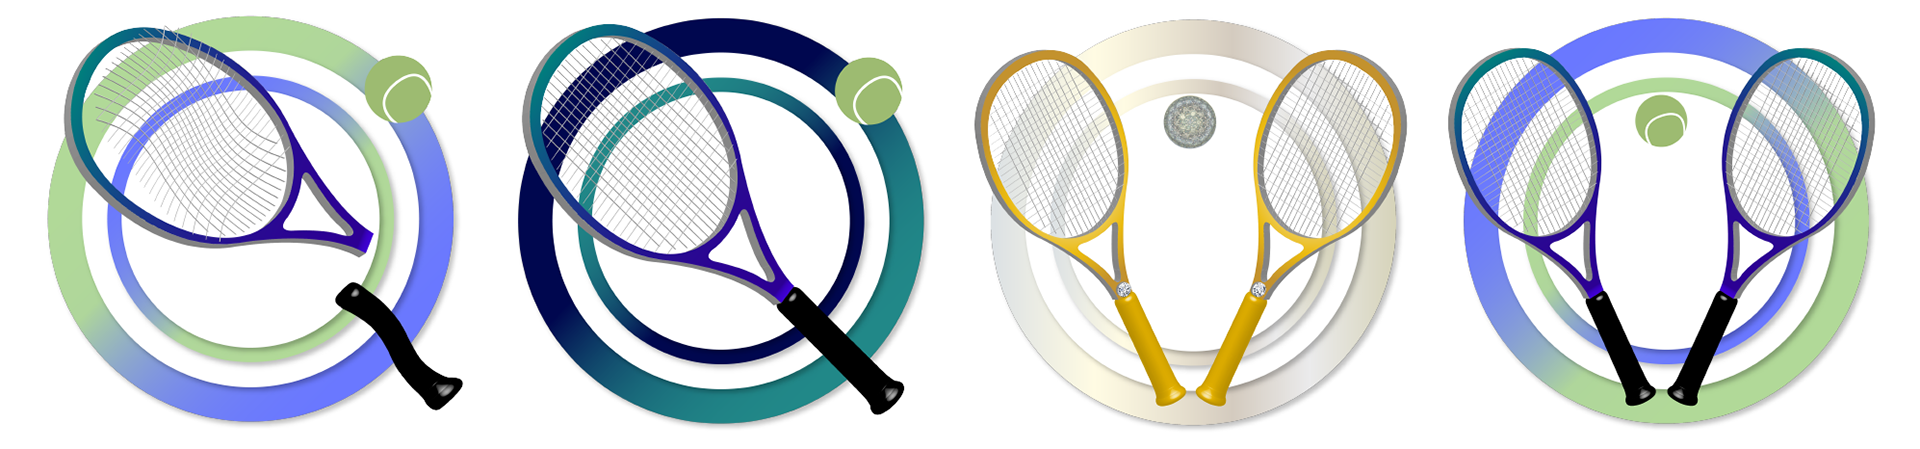
The interactive experience includes three sounds to differentiate "poor", "good", and "superb" swings. The quality of swings are in relation to a speed of "slow", "average", or a "fast". Data was gathered from test swings in order to capture a range for the three swings. The graphics of the sport change for each practice swing.
When the user decides to exit the practice session, they click the "x" button on the top right to go to a page showing the total count number. The user also has the option to share on social media to document their experience.
The user would first choose from a list of sports to practice with the Myo armband on. The user can exit or start swinging as PracTest keeps count according to arm movements.
The interactive experience includes three sounds to differentiate "poor", "good", and "superb" swings. The quality of swings are in relation to a speed of "slow", "average", or a "fast". Data was gathered from test swings in order to capture a range for the three swings. The graphics of the sport change for each practice swing.
When the user decides to exit the practice session, they click the "x" button on the top right to go to a page showing the total count number. The user also has the option to share on social media to document their experience.
SCREEN DETAILS
The mobile app was primarily focused on the hardware integration, and user interface interaction was kept minimal and simple for a straightforward user interaction. Since the entire app was to count the speed of practice swings, I focused on creating simple, yet engaging 3D sports graphics to show the different states of the speed of swings. The screen provided the quality of the swing, overview of swings for that session, and a simple button to exit the application. Simple interactions were key since the user would probably be occupied with holding a tennis racket with at least one hand.
The mobile app was primarily focused on the hardware integration, and user interface interaction was kept minimal and simple for a straightforward user interaction. Since the entire app was to count the speed of practice swings, I focused on creating simple, yet engaging 3D sports graphics to show the different states of the speed of swings. The screen provided the quality of the swing, overview of swings for that session, and a simple button to exit the application. Simple interactions were key since the user would probably be occupied with holding a tennis racket with at least one hand.

Front-end Development, Design: Sarah Han
Front-end Development, Back-end Development: PA Lava, Brian Cottrell
Front-end Development, Back-end Development: PA Lava, Brian Cottrell